Report
The Dynamics of Satisfaction with Working Hours in Australia: The Usefulness of Panel Data in Evaluating the Case for Policy Intervention, by Breunig, Gong and Leslie
Introduction and overview
There is a lot of pressure on governments to improve societal welfare. Public policy interventions are a very important part of its function and choosing the most effective public policy interventions are important for a government, where a wrong implementation could have severe adverse effects. There is a potential need for further policy with regards to a working hour mismatch.
Australians have been feeling increasingly dissatisfied with the number of hours that they work (Cassells, 2017). There is a case for a policy intervention if this problem rises to the appropriate levels – are a significant amount of people dissatisfied with their working hours and how serious is this problem? This essay discusses the paper by Breunig, Gong and Leslie which delves deeper into the roots of hour dissatisfaction (Robert Breunig, 2014). There is a lot of literature currently available which discuss these issues, the way this paper sets itself apart is that it gives a more thorough analysis of an hour mismatch. To see if a certain intervention is worth doing there is a need to evaluate the correct metrics. Breunig et al look at satisfaction with working hours in Australia and if a government intervention is needed to alleviate any of the issues found. They suggest the metrics of prevalence, severity, and persistence and if an issue were to affect some amount of these measures at a considerable rate, then an intervention would be needed.
This essay replicates the main findings relevant to this essay and proposes an extension which looks deeper into the potential causes for an hour’s mismatch, namely overemployment.
Existing Literature
There has been found to be a negative relationship between health and a working hour gap, which is the difference between actual and preferred hours an individual would like to work (Riyana Miranti, 2020). Interestingly, overemployment seems to have a bigger strain on mental health than underemployment (Marc L Adam, 2006). This further raises the need for a potential government intervention and there are a lot of studies already published that look at a working hour mismatch among Australians. This section will focus on those most relevant to the paper by Breunig et al and the proposed extension.
Underemployment has been increasing over the past few decades and since 2000, those underemployed have outnumbered those who are unemployed, and most of these people work part-time. 9.3% of women are underemployed, compared to 5.4% for males and young people adversely effected. Underemployed individuals typically have lower qualifications – more than half of those underemployed had year 12 or below qualifications. Family circumstances and training are also found to influence this. For those underemployed who look for more hours or other jobs, the main issues that they run into are either a lack of job vacancies or a lack of skills and experience. This is more prevalent among older workers where long-term underemployment is a bigger issue (ABS, Australian Social Trends, 2010).
Conversely, more and more people are being overemployed. Overworking can cause an array of issues, from mental health as discussed before, to stress, fatigue, burnout, and a work-life imbalance which can cause strains on relationships. Roughly 20% of all workers in Australia view themselves and over-working and for these people the average hours they actually work was 67, while the average hours they would prefer to work is 42. This seems like a huge imbalance and this paper delves deeper into this relationship. There are certain risk factors that are associated with overemployment; being male, between the ages of 35-65, if you are likely to have young children or have a partner. In some causes it could be the case that long working hours represent an investment that individuals make to enhance their prospects for progression within their career (ABS, Australian Social Trends - Overemployment, 2011).
This then lends itself to the question – why do people want to work less? The obvious answer is to reduce the stress and issues caused by overworking addressed above but more often the reasons are due to social outings, having more time to yourself and caring for your children. As these issues are seemingly so prevalent, the government has taken previous action to aid the burden for these individuals with an hour mismatch.
There has been attempts by the Australian Government for policy interventions which were hoped to have relieved these issues. The Fair Work Act was introduced in 2009 and puts out a national guideline on the hours worked by an individual. A minimum of 10 hours and a maximum of 38 hours/week, plus reasonable additional hours. There has been surprisingly little to document the effects of this policy - the act comprises a whole list of potential improvements to Australian Workers and working hour guidelines are a small portion of the policy. The effects of this policy seem fairly muted with regards to a change in working hours (Sloan, 2010).
The prevalence of working hour mismatch is commonly studied and overemployment is typically found to be more common than underemployment (Wilkins W. , 2012). The analysis in this domain is rich enough that certain characteristics are now likely to be associated with each state of employment (ABS, Underemployment, Technical Report, Australian Bureau of Statistics, 2010). There also exists analysis which pertain to severity and these two metrics have been widely studied within Australia (ABS, Technical Report, 2011). What seems to be missing in these analyses are a combination of prevalence and severity measures as well as a measure of how these metrics persist into the future.
The study aims to give a better treatment of the dynamics of working hours in Australia and to do so they use panel data from the first 11 waves of the HILDA survey, which follow individuals from 2001-2011 and asks them the same questions once a year. The dataset contains thousands of questions and individuals, and only a few questions which relate to working patterns and preferences are selected for the purpose of this analysis. The authors make use of the panel data format and provide a more comprehensive analysis on persistence.
3. Data and methods
The three main contributions of this study are its analysis on prevalence, severity and persistence and this section will look at each individually. An extension that includes the newer waves has been appended onto each table and a graph summarising the results are available for each category.
3.1 Prevalence
Prevalence was found by looking at the responses that the respondents made to working hours preference question:
#jbhrcpr: Q) If you could choose the number of hours you work each week, and taking into account how that would affect your income, would you prefer to work: – fewer hours than you do now – about the same hours as you do now or – more hours than you do now?
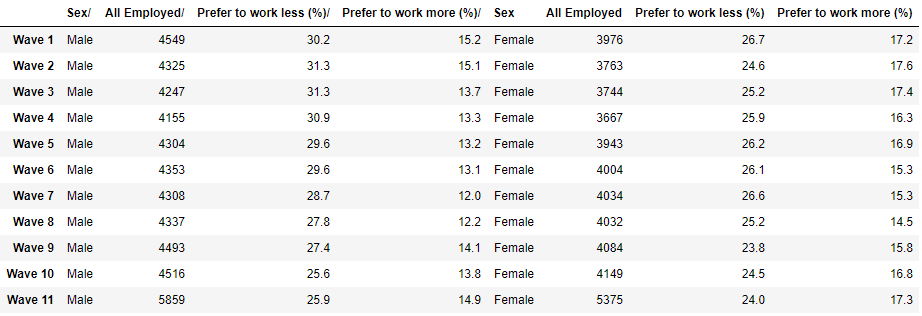
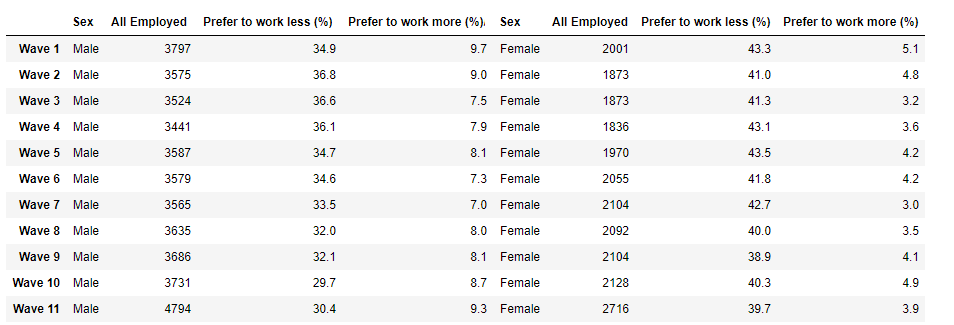
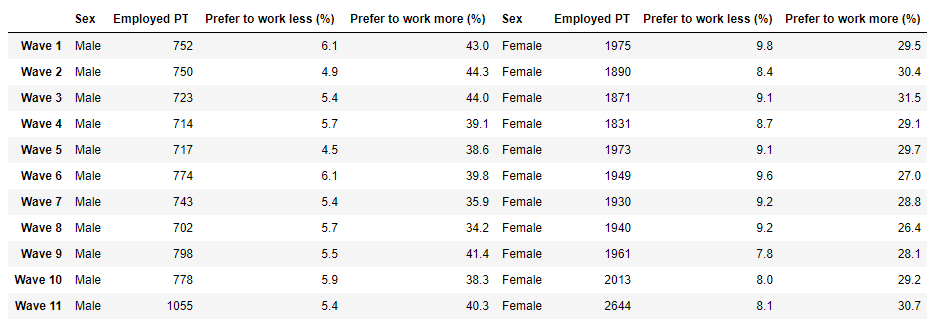
Tables 1, 2 and 3 show the prevalence of a working hour mismatch for individuals who are employed, working full-time, and working part-time.
Table 1: All Employed
With extension:

Table 2: Full-time employment
With extension:

Table 3: Part-Time employment
With extension:

These replicated results are largely the same as the study paper, with slight discrepancies in the amount of number of observations. The new added waves are largely a similar extension to the previous waves, however there is a slight increase in individuals wanting to work more and a decrease in individuals wanting to work less. A summary of the mean of the above tables are given below.
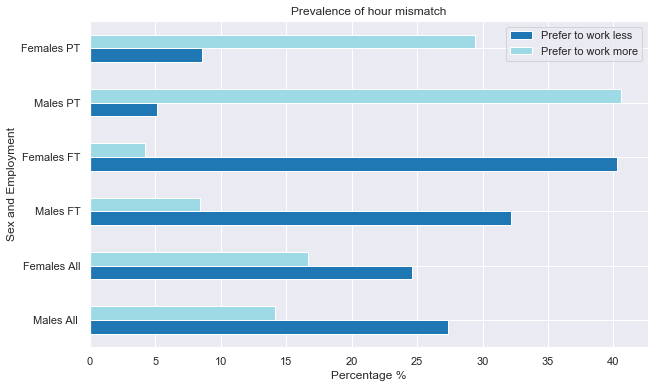 Graph 1: Prevalence of hour mismatch
Graph 1, along with tables 1-3, show that for full-time and all employees, preferring to work less, or overworking, is more prominent than preferring to work more. For part-time workers this is the opposite, where they prefer to work more hours. However, as part-time workers number a lot less than full-time, for all participants, overemployment is more common than underemployment.
The differences are similar between the sexes; however, full-time females want to work less more often than males and part-time males want to work more often than females. With the analysis above, it seems that approximately 40% of all employed individuals have an hours mismatch where their preferred hours are different to their actual hours worked. The next section looks at how severe this mismatch is.
3.2 Severity
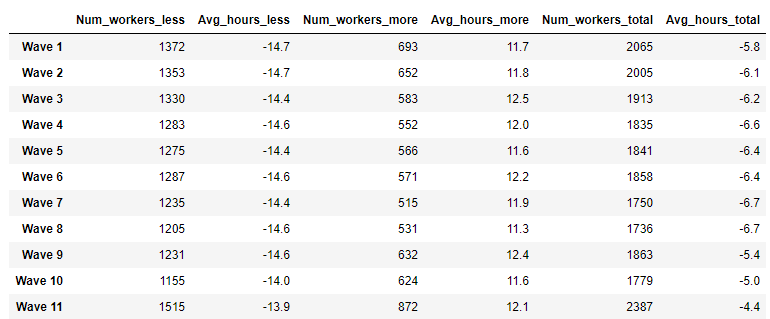
Table 4: Difference between preferred and actual hours for males
With extension:

Table 5: Difference between preferred and actual hours for females
With extension:

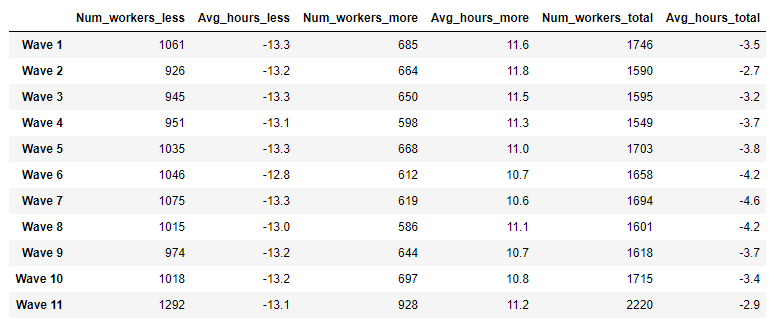
The above tables show the severity measures for males and females. The values are largely similar to those found in the study. With the addition of the extended waves, it appears as though the total hour mismatch have decreased. Graph 2 shows a visualization of the distribution of the hour mismatches. 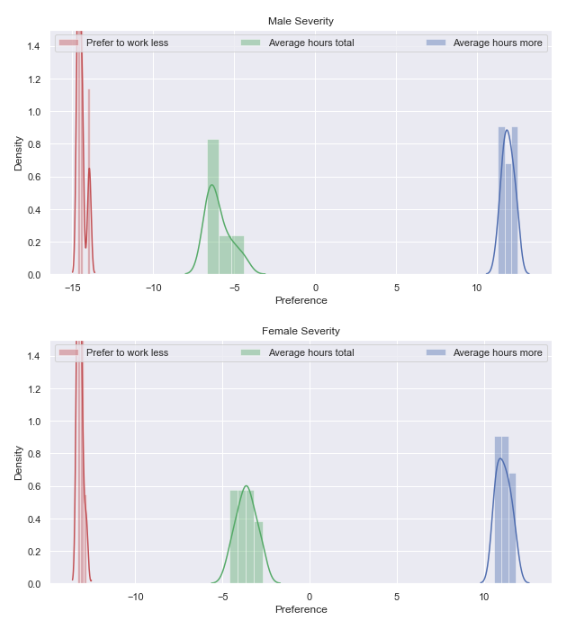
Graph 2 (left): Severity of an Hours mismatch
The values between each wave are consistent and similar between males and females. The x-axis shows hours and the y-axis shows the density. Males and female prefer to work less by around 14 hours, and they prefer to work more by about 10 hours. The average preference severity tends to indicate that people would rather work less than more.
Severity was measured by the difference between actual hours worked and hours the individuals would like to work (preferred hours). The variable for actual hours is #jbhruc, and preferred hours is #jbprhr. The study derives a new jbprhr variable, as those who selected actual hours to be the same as their preferred hours were not asked for their preferred hours, to include this discrepancy. However, the database imputes this missing value itself and saves it as the jbtprhr variable, which is what was used for this replication.
3.3 Persistence
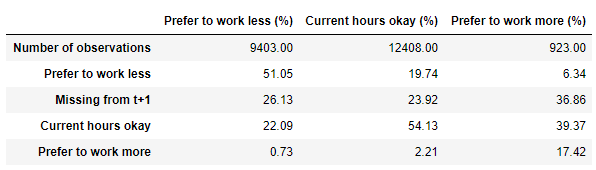
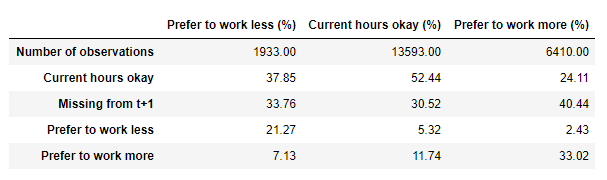
Persistence was measured by looking at the responses between two consecutive waves for the severity measure, averaging this for all the waves, and seeing whether the participants had their situations changed. This is shown by Table 6 and 7 and visualized by graph 3.
Table 6: Persistence of hour mismatch among males
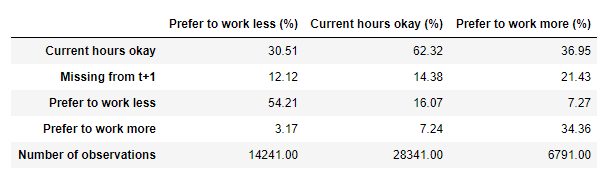
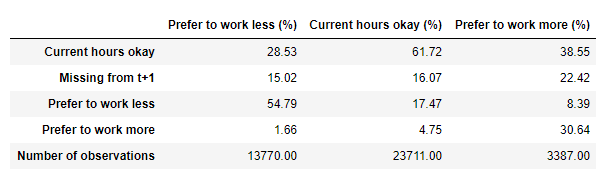
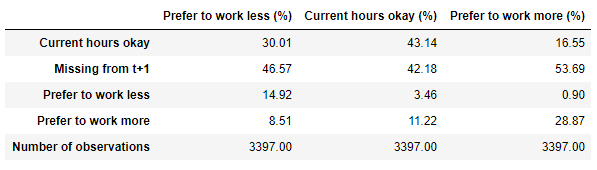
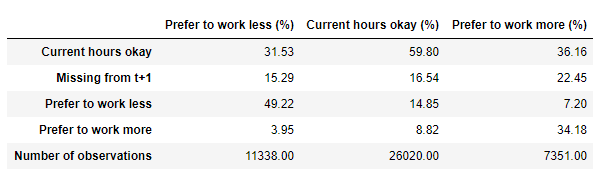 Table 7: Persistence of hour mismatch among females
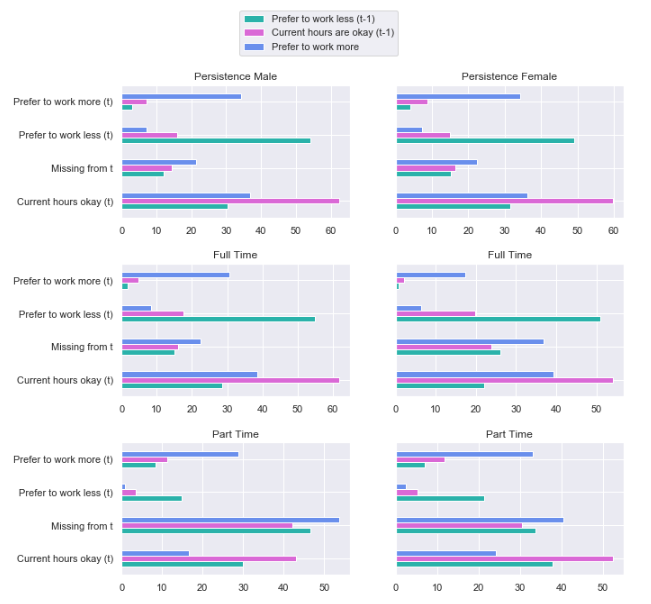 Graph 3: Persistence over time
The authors took a baseline for the participants preference (t-1) and saw how that preference changed into the next wave (t). This is shown visually in Graph 3 – where the y-axis is the new preference at time t, and the x-axis shows the propositions of how this preference has changed. The graph is a summary of Tables 6 and 7. The left column shows male, and the right shows females based on their employment status.
The relationships are similar among men and women. Most individuals were able to resolve their working hour mismatch, however those who were overworked in the previous year are more likely to still be overworked. This hour mismatch does not seem to resolve when looking at a one-year time frame.
The authors then take a few steps to look deeper into persistence. If the problem resolves, is it actual hours that change or is it preferred hours? What they found was that adjustment of preferred hours was larger than the change in actual hours. Table 8 shows this relationship. Past time (t-1) is on the x-axis and current time (t) is on the y-axis. Row 1 shows an individual that was content with their hours at t-1 and is now dealing with fewer hours at t– i.e. they developed a desire for fewer hours. The table then sees what has changed to cause this, was it actual hours or preferred hours.
Table 8: A change in preferred or actual hours
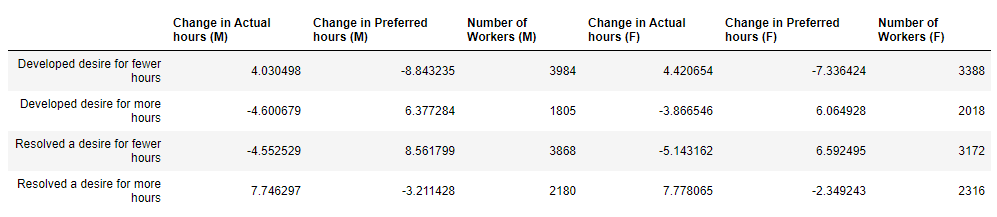
For the group that resolved underemployment (last row in Table 8), they were found to increase their actual hours worked, more so than preferred. For all the other groups, preferred hours changed at a higher magnitude than actual hours. Participants were more likely to change their expectations of their working hours if they had a mismatch rather than the actual hours, if they were not underemployed.
The researchers then asked how actual hours and preferred hours relate to each other. They found that for a mismatch to be resolved preferred hours and actual hours move together through an inverse relationship. Breunig, Gong and Leslie found that the desire to work less (overworking)was a much more prevalent issue than a desire to work more (underworking) and any sort of policy intervention to try and fix this issue would reduce the labour supply. However, most mismatches were resolved in one year. The one exception to this was for those who work full-time and want to work less, their problem persists into the future. The study concludes that if people can freely change jobs, an hour mismatch does not qualify for any sort of policy intervention. However, there might be a case to be argued for intervention if the job market is rigid and individuals are not able to freely change their working arrangements.
The extension on this study will have a more detailed analysis of overemployment, particularly of what causes it. We would be able to understand the effects of certain characteristics of whether an individual had a working hours mismatch and which variables would influence an individual to be over-employed. It would tell us why individuals are overworked, with the hope that future government interventions could be more specific and more effective if needed.
Extension
This extension will look at what the risk factors are for an individual to over-work. If these can be deduced, a more focused government intervention could be introduced to reduce the burden on these individuals. A multinomial logistic regression was used to find a model for if an individual had an hours mismatch in one wave, and a fixed effects panel OLS was conducted on all the waves to find the change in actual hours caused by these factors. Before this, certain independent variables need to be selected. There are a few hypothesis of why individuals are overworked which can aid in finding the regressors, largely taken by the work of Drago, Black and Wooden (Robert Drago, 2005).
1) Consumerism: Individuals overwork to sustain their levels of spending. They may take on debt to facilitate this spending and so debt, income as well as debt will be included as regressors.
2) Ideal worker norm: This is a theory that individuals in a workplace expect themselves and others to adhere to some sort of ideal worker norm. Where they work the position for long hours, while having few breaks or holidays. There are several nuances of this theory, namely that it changes heavily by profession, but a large portion of it will be measured by job flexibility.
3) Human capital: Due to individuals paying a lot for formal education, there is a need for these individuals to work long hours to try and increase the return on their investment. These individuals will also have a chance of a high paying job and due to consumerism could potentially work longer hours. Education will be included.
4) Gender and family: Women are still typically more likely to do household activity than men and so men are more available to take on longer hours. Married couples could also potentially want to work less hours.
A few other variables will be included due to the results seen in the replication. Full-time workers are more likely be overworked than part-time workers or casual workers. If whether an individual comes from a non-English speaking background could perhaps impact the hours they work. As further controls, union membership and if individuals are indigenous or not will also be included.
Multinomial Logit Regression
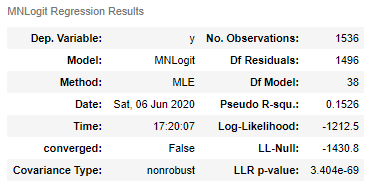
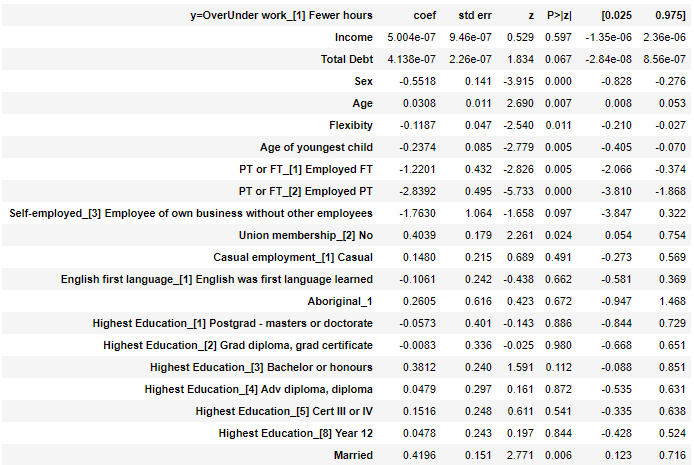
A complete multinominal logistic regression model is shown in Appendix I. A summary of the important relationships are below.
Table 9: Summary of multinomial logistic regression for overemployed individuals
| Y = Want fewer hours (overemployed) | Coefficient | Standard Error | P > | z | |
|---|---|---|---|---|---|
| Sex | -0.5518 | 0.141 | 0.000 | ||
| Age | 0.0308 | 0.011 | 0.007 | ||
| Flexibility | -0.1187 | -2.540 | 0.011 | ||
| FT | -1.2201 | 0.432 | 0.005 | ||
| PT | -2.8392 | 0.495 | 0.000 | ||
| Employee of own business without other employees | -1.7630 | 1.064 | 0.097 | ||
| Union membership | 0.4039 | 0.179 | 0.024 | ||
| Marriage | 0.4196 | 0.151 | 0.006 |
With the above regression, the base category, y = 0 is ‘About the same’ hours, and y = 1 is ‘Want to work fewer hours’. All the above regressors, with the exceptions of ‘employee of own business without other employees’, can reject the null hypothesis at a significance level of 0.05. We can see that males are 0.55 times less likely to be overworked than females, and as individuals age, they are slightly more likely, 0.031 times, to be overworked. Individuals who work full-time (FT) or part-time (PT) are both less likely to be overworked – since there are more people satisfied or want to work more hours than those who are overworked. Individuals who are in a union or in a marriage are about 0.41 times more likely to want to be overworked
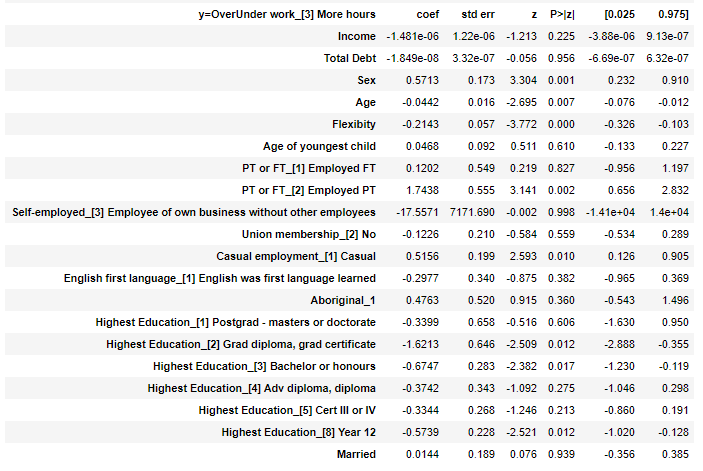
Individuals with a highest education level of postgraduate or graduate diploma are less likely to be overworked, although not statistically significant. Those with a bachelor’s degree are the most likely to be overworked and individuals with a Year 12 as their highest education level were least likely to be overworked. None of these results were statistically significant and they can be found in the appendix. A regression on underemployment was also completed due to the multinomial logit model and is included in the appendix. As this extension focuses on overwork, only the above was properly analysed – however the relationships for underwork follow an inverse of those listed above. The R2 value of the model indicates that only 15% of the variation in a working hour mismatch is due to the factors within the model. As such, a better model needs to be put into place. As the previous regressors are highly correlated with a working hour mismatch, it is likely the case that there is some omitted variable bias. This can be overcome with a fixed effect model which leverages using the subject-specific means and as such would give an accurate model of a within individual estimation (Allison, 2009).
Another disadvantage of the previous regression was that it does not tell the increase in hours for each variable, there is no accurate measure of severity of each coefficient. For this case, a regression with actual hours worked as the dependent variable needs to be used.
Fixed Effects Panel Data Regression
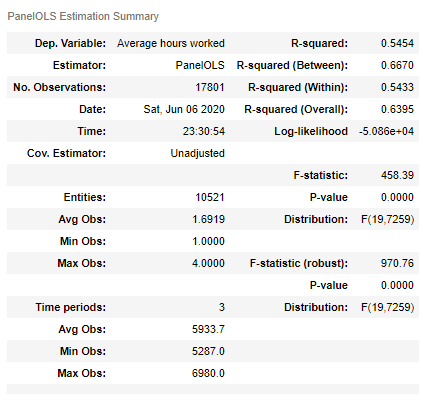
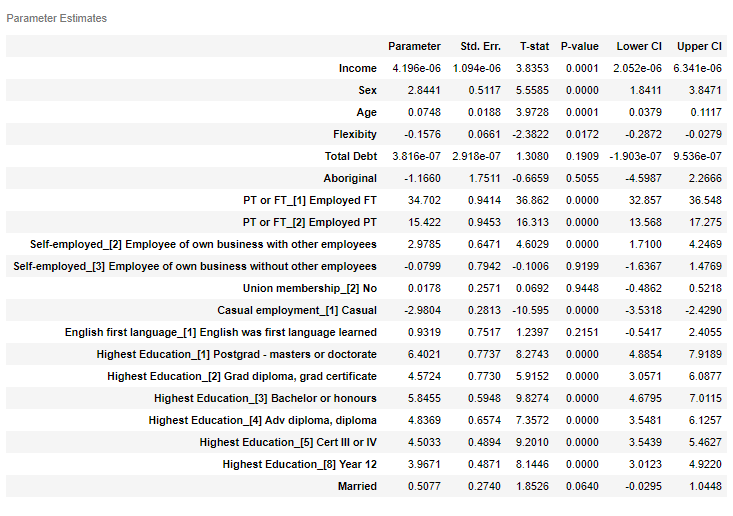
From the Panel Data regression above, the previous regression results are largely supported. Males are likely to work 2.8 hours more than females, those with a business with other employees work 2.9 hours more than others. The more flexibility an individual has in their work environment, the less hours they work. Union membership however makes no difference to an individual’s working hours, nor does if English was the first language learned. Regarding education, the higher education an individual has the more hours they likely would work. The fixed effect model is better than the previous multinomial logit and explains 54% of the variation within individuals. A few limitations of this was that only 3 timeframes were included instead of all the waves, the relationships among the regressor and dependant variable would likely stay the same although some would perhaps show more significance. There was not any relationship between income, debt and working hours even though the theory says that there should have been. Going further, an income/debt ratio should instead be used.
There is more that needs to be done to prove the need for any sort of government intervention. However, any future policies could have their scope more focused due to this extension. Specifically for policies targeting those who are over-worked, the policies could focus on those with a higher education, are a owner of their own business with other employees, are older in age and perhaps understanding why there is a gender gap in the hours worked among males and females.
Conclusion
Maintaining and enhancing societal welfare is a core component of a government’s responsibilities. The most striking find of the study by Breunig et al was the scale of workers who are overemployed, however the authors do not touch much on this as an issue. There is a big problem of overemployment, but the authors brush aside policy intervention due to any relevant intervention reducing labour supply (Robert Breunig, 2014). The aim of government policy is improving the welfare of its citizens and while economic factors should be a large factor, it is secondary in this regard. This extension focused on the risk factors that could cause an individual to be overemployed and could tailer a more specific government response.
The authors convey quite concretely that this problem does not merit an intervention, although because of the problems that persistent overemployment could cause to the wellbeing of an individual, the question of whether the government should intervene remains. There are studies that have addressed this issue that have been previously mentioned and the government’s response was to introduce the Fair Work Act. Unfortunately as the scope of this policy was very large and encompasses a lot of regulations in regards to the labour force, the effect it had on a working hour mismatch was muted (Sloan, 2010). A more tailored approach to individuals who are overemployed is possibly needed, and further analysis needs to be done with regards to its persistence.
References
ABS. (2010). Australian Social Trends. ABS. (2010). Underemployment, Technical Report, Australian Bureau of Statistics. ABS Australian Social Trends.ABS. (2011). Australian Social Trends - Overemployment. Allison, P. D. (2009). Fixed Effects Regression Models. Cassells, R. (2017). How satisfied are australians at work? Curtin University.Marc L Adam, P. F. (2006). Job insecurity and mental health outcomes: an analysis using waves 1 and 2 of HILDA. The Economic and Labour Relations Review.Riyana Miranti, J. L. (2020). Working hours mismatch, job strain and mental health among mature age workers in Australia. The Journal of the Economics of Aging.Robert Breunig, X. G. (2014). The Dynamics of Satisfaction with Working Hours in Australia:. Asia and the Pacific Policy Studies.Robert Drago, D. B. (2005). The Existence and Persistence of Long Work Hours. University of Melbourne.Sloan, J. (2010). Evaluating the Fair Work ACT. Policy.Wilkins, W. (2012). A Statistical Report on Waves 1 to 9 of the HouseHold, Income and Labour Dynamics in Australia Survey. Families, Incomes and Jobs, Volume 7.
Appendix
Appendix I: Multinomial Logit Regression Results
Regression output